

KMAX Product Brief
The KMAX Network Emulator
Real world networks have long distance links, satellites, congested routers, firewall inspection, packet interception, hardware failures, and other outages. But the networks in most software development labs are too fast and too clean – not at all like the real Internet. You must test and verify application performance prior to deployment. A poorly performing app can erode user confidence and damage your reputation.
Assure success by emulating real-world network conditions in the lab, and subject the application to the full range of network conditions likely to occur.


KMAX Family Models C, MM, and P.
Front and back views.
Emulate the Real World in Your Lab
The KMAX network emulator helps network engineers test and measure performance in order to identify and remove defects. Network emulators turn well behaved development and test networks into the kind of slow, congested, and less-than-reliable services encountered on the internet.

In addition, unlike the real internet, network emulators allow the operator
to control these conditions so that products and apps can be subjected to controlled and repeatable tests, by routing selected packets through a series of impairment nodes.
The Result:
Deliver robust, high quality products and applications
Accelerate time to market
Eliminate guesswork and surprises
Completely characterize your app’s network performance
State of the Art, Fully Intuitive User Interface
Use the KMAX Network Emulator from any web browser on a tablet or desktop. Use the Wizard to guide you through set up and operation. Point and click to select the scenario closest to your production environment. KMAX scenarios contain sets of network impairments -- drops, delay, jitter, etc. — that may be fine tuned and adjusted to match your environment.

Scenarios - predefined models of your operation
Select a pre-defined, network emulation scenario from our library. With more than 70 scenarios to choose from, KMAX will probably have exactly what you need. Pre-built library scenarios feature intuitive controls that appear on top of an end-to-end diagram of the whole network, to provide a bird’s eye view. You can also add your own custom background diagram. Let us show you how it works!
Create Your Own Scenario
Do you already understand the way your app or device will be used in the real world? Do you want to define the most likely routine environments as well as the possible extreme environments? You can create your own scenario! Use one of ours and make adjustments or define your own.
Packet Drop/Loss: Add “burst mode” for a realistic emulation.
Packet Delay/Latency: From zero to 3600 seconds, with millisecond precision.
Packet Jitter, with or without reordering. Specify a custom jitter distribution: Uniform, Gaussian, Pareto, or Pareto-Normal:

Uniform Distribution

Gaussian Distribution
Packet Duplication, with rapid back-to-back transmission.
Packet Corruption: Specify packet-centric or bit-centric probabilities of corruption.
Rate limiting: Choose From several queue management algorithms.

Pareto Distribution

Pareto Norm Distribution
Model Worst-Case Situations:
Turn on burst mode for any impairment, to simulate back-to-back real-world stochastic bursts.
Add time-varying expressions to any parameter.
Regardless of the production environment – anything from the routine to the extreme to legacy – KMAX permits customization to precisely emulate that world.
Incorporate Real or Simulated Traffic:
KMAX accommodates all forms of real or simulated network traffic:
Use real devices to generate packets, then impair only selected packets and protocols under consideration, while filtering out the rest.
Or, use a packet generator to create simulated network traffic for the device under test, then apply impairments only to those packets, leaving the rest of the network unaffected.
Classify Network Traffic
Create filters for the packet classifier using the Classifier Filter Library, or create your own filter, then apply different impairments to different filter outputs. Examples of filter criteria include:
IEEE 802 header fields: MAC source/destination addresses, Ethernet type/length, MPLS criteria, VLAN tags.
IPv4 or IPv6 header fields, including chained headers, fragment status, and QoS.
Higher level protocols: UDP or TCP port numbers.
Data within the payload, for any layer.
Equation
Piecewise Linear

The KMAX Smart Classifier Filter System puts you in charge to use intelligent criteria for packet classification:
Specify flexible value/mask comparisons: useful for matching addresses, QoS criterion, and payload bytes:

Specify lists of values and ranges for comparison: useful for port numbers, VLANIDs, and payload sizes:

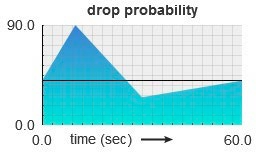
Real world networks change their behavior over time: excessive jitter, dropouts, or reductions in bandwidth can vary smoothly, or jump from one value to another, over the course of minutes, or days. Create a network emulation that varies the impairment parameters over any time period:


Shaped Pulses
Specify a time-varying expression for any metric, using equations, piecewise curves, or shaped pulses:
Examples
▶ Test your streaming clients: The device under test should handle time-varying impairments, and perform flawlessly, for days.
▶ Run your protocols continuously, while the time-varying impairments cover all corner cases–perfect for overnight stress testing.
Remote Control via KMAX API
The KMAX web server API provides remote control over all aspects of KMAX, including the impairment engine and statistics gathering. The KMAX API Guide describes the commands that you can use to insert KMAX directly into your testing pipeline:
Plug KMAX into your existing diagnostics tools, for custom statistics collection and display.
Automate KMAX reconfiguration, to run different configurations for different tests - essential for overnight testing.
Add a fully custom user interface, by using any scripting language with an HTTP client.
KMAX Documentation
KMAX System Guide
KMAX QuickStart Guide
KMAX Quick Reference Guides
Stencils for creating network diagrams
KMAX API Guide
Charts, Graphs and Tables
View network emulation statistics in tables and charts (graphs). Add any number of tables or graphs to one or more browser windows, then monitor the values while you change impairment settings. You have the flexibility to see everything going on in the KMAX server:
Display packet rates and packet counts at all points in the KMAX impairment process, such as interface ports and flow inputs, for precise analysis.
Display individual impairment statistics: packets dropped / duplicated / jittered / delayed, etc: A total of 17 metrics.
Select any unit of representation: bytes/sec, bits/sec, packets/sec, total bytes, total bits, and total packets.
Graph highlights:
Each graph can chart two parameters ,for side-by-side comparison.
Switch between linear or semi-log axes: essential for analyzing metrics that vary over many orders of magnitude.

Table highlights:
The table can display dozens of parameters simultaneously
The table allows quick identification of many correlated metrics, for enhanced troubleshooting and understanding.

KMAX Specifications
System Packages:
Hardware Configurations:
Cube: 8.47" (W) x 7.13" (H) x 11.22" (D)
Lunchbox: 5.31” (W) x 2.09” (H) x 6.1” (D)
Tablet: 158 mm (W) x 28 mm (H) x 155 mm (D). 6.22” (W) x 1.1” (H) x 6.1” (D)
Software Only Configuration: Virtual Machine (VM)
Interfaces: 10/100/1000 Mbits/sec and 2.5/10 Gbits/sec
Operating System: FreeBSD
Layer 2 transparent bridge
Impairment Engine: Kernel-driven impairment engine
User Interface:
Web-based graphical user interface
Command Line Interface
Script control with Python or Java
Script control with RESTful interface
Script control with JSON interface
Script control with YAML interface
Standard Impairments:
Packet Delay/Latency:
Specify packet delay / latency
Vary packet delay / latency over time *
Add jitter to the delay
Add jitter to the delay with packet reordering
Packet Jitter
Jitter Distribution:
Normal / Gaussian / Bell curve
Pareto
Pareto-Normal
Uniform (equal)
Piecewise distribution function / user defined
Packet Duplication:
Specify duplication probability
Vary duplication probability over time *
Enable bursts:
Specify burst probability
Specify burst window duration
Vary burst probability over time: *
Enable burst skew
Packet Drop / Loss:
Specify drop probability
Vary drop probability over time * :
Enable bursts:
Specify burst probability
Specify burst window duration
Vary burst probability over time: *
Enable burst skew
Manipulate contents of headers and payloads:
Randomly corrupt a packet
Intelligently corrupt a packet
Create a packet and selectively insert into the flow
Dynamically create and change distinct flows of packets
Inspect packet headers to select packets for modification
Rewrite packet headers
Rewrite packet data
Rate Limitation:
Specify:
target rate
queue length
overhead bits
minimum packet size
maximum packet size
Vary any of the above over time: *
Support bit clocking rate control
Support token bucket rate control
Mark for drop or random early detection
Specify transition action on queued packets
Flush queue
Packet Corruption:
Specify corruption probability
Limit corruption to Ethernet payload
Specify burst probability
Vary burst probability over time *
Emulated Links / Multiple Flows:
Unidirectional and bidirectional packet flow
At least 5 flows in each direction; 10 total
Larger models: 64 flows in each direction; 128 total
Classify packets based on:
IPv4 header fields
IPv6 header fields
MAC source or destination addresses
Ethernet type or length field
IEEE 802 header fields (includes VLAN tags)
Data within the packet
Classify packets based on fields in protocols:
Low-level protocols:
arp
dhcp
icmp
mpls
spanning-tree
IP layer:
IPv4 packets of varying lengths
IPv6 fragment
IPv6 fragment_last
IPv6 flow range
TCP / UDP layer:
Any TCP packet
TCP port numbers
Any UDP packet
UDP port numbers
http
DNS
SIP
Applications layer:
VoIP
VoIP with QoS bits in various configs
Apply different impairments on each emulated link
Select and modify packets based on:
The content of that packet
The content of predecessor packets
The content of packets in other flows
The mathematical model of packet flows
The position in the protocol handshake
*This can be done by selecting a simple pulse model or using a list of value/duration pairs
Maxwell Patent No 7310316
Testing device US 7310316 B2
ABSTRACT
A test device (21) sits between two or more nodes (20, 22). The nodes (20, 22) communicate in conversations, according to some predetermined protocol. The test device (21), under user control, may introduce jitter, drop packets, create new packets, reroute packets, and reorder packets in the conversations. Particular conversations are detected and tracked by respective virtual state machines (38, 39, 40) within the test device.